Which 90%?
On a fair count, gas drove about half the rise in the cost of household electricity. Ninety per cent needs a start at the 2020 low and two tax changes counted as savings.
In his Substack essay Realism needs today’s facts, Jan Rosenow writes that “more expensive gas is responsible for nearly 90% of the rise in UK household electricity bills since 2020”. His chart says the same. We rebuilt his table from his own spreadsheet and Ofgem’s figures, then ran it again from every start date the price cap allows.
On his own method, every start date before Covid gives 54% to 71%. Only starts from April 2020 to April 2021, around the cheapest year for wholesale power since 2004, give 80% or more. And his sum counts two costs moved off the bill, onto taxpayers or into a six-month tax holiday, as if they had been saved.
On the bill as paid, his arithmetic is right: VAT and the levies did come off it. Our measure asks a different question: what drove the cost of supplying the electricity. His own spreadsheet already gives lower answers than 90%: 60% from 2018/19 on his own method, and 54% from October 2020 if you count only the costs that rose.
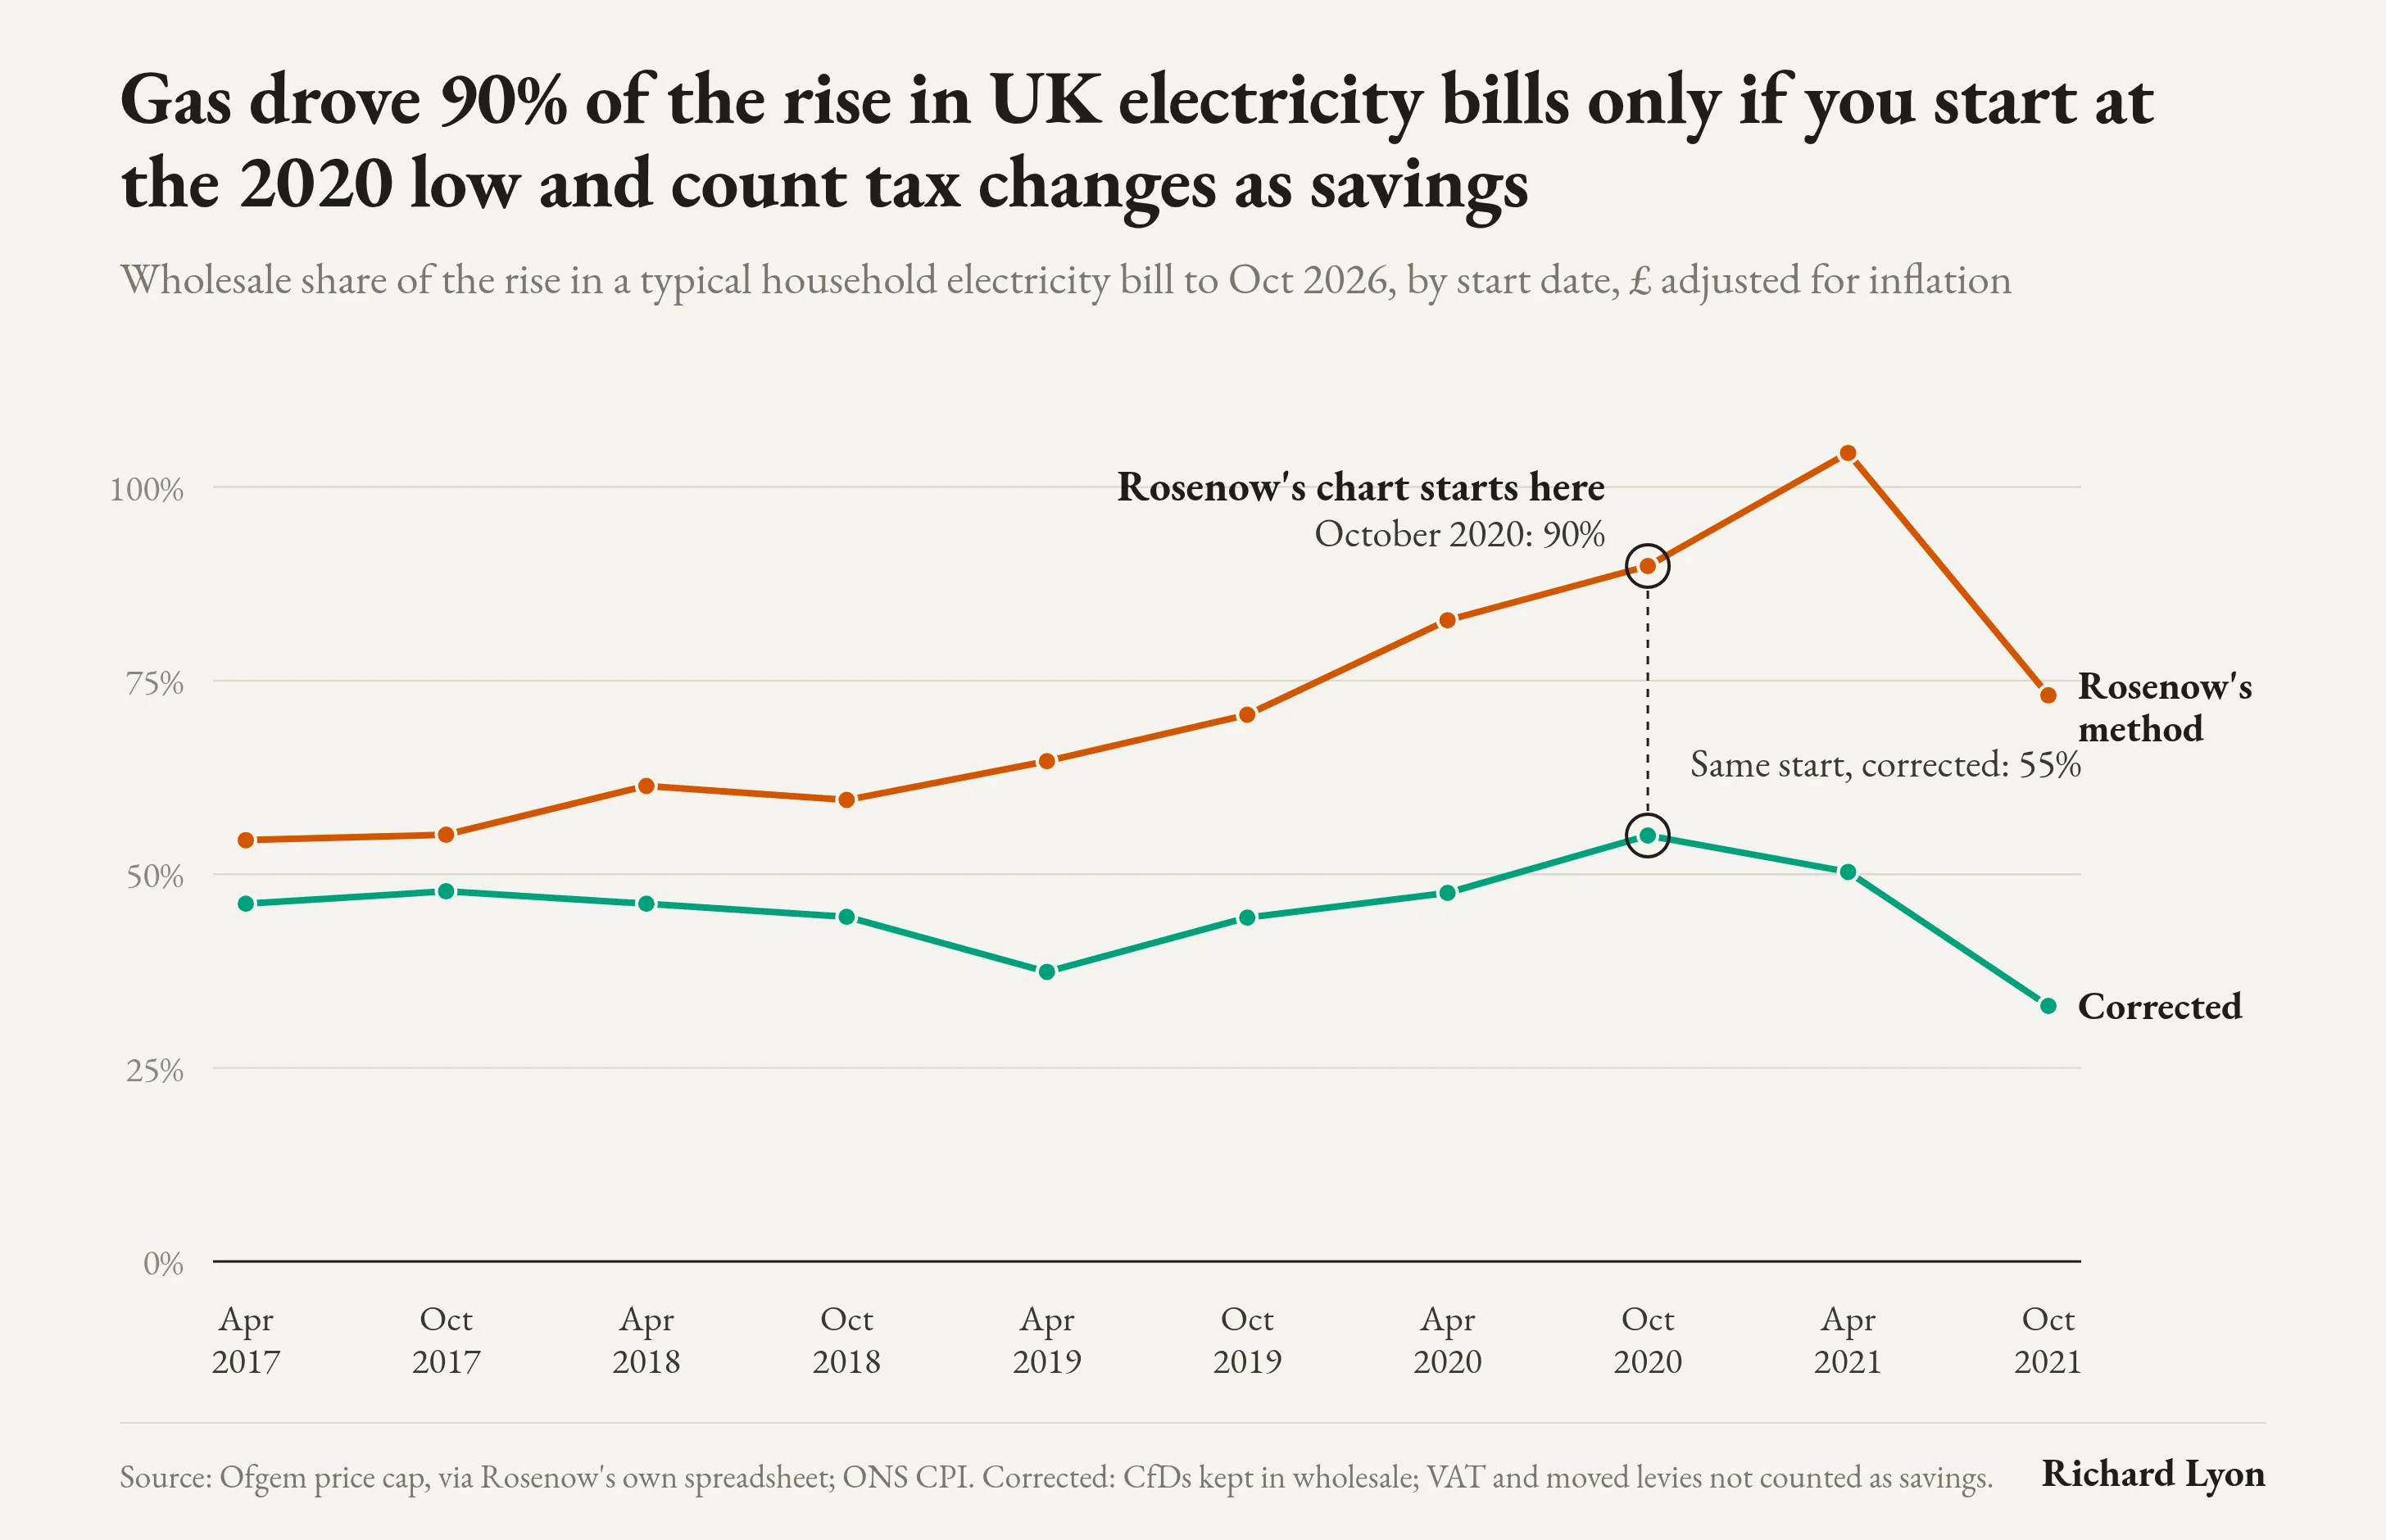
Rosenow’s method. Wholesale, with CfD payments split off, divided by the net change in the bill. The net change subtracts the VAT holiday and the levies moved to taxpayers, as if they were savings. Because rises and falls are netted off, the share can pass 100%: from an April 2021 start it is 104%.
Corrected. Wholesale, with CfD payments left in, divided by the change in the costs still on the bill. VAT and the moved levies are left out, because the cost was moved, not cut.
From the same start date, October 2020, the corrected share is 55%. From a typical start date it is 46%, the median across every start from 2017 to 2021.
Our Comment Which facts? used a simpler measure, the share of only the costs that rose. On that measure wholesale is 54% from October 2020 and 44% from 2018/19.
Four choices take 45% to 90%
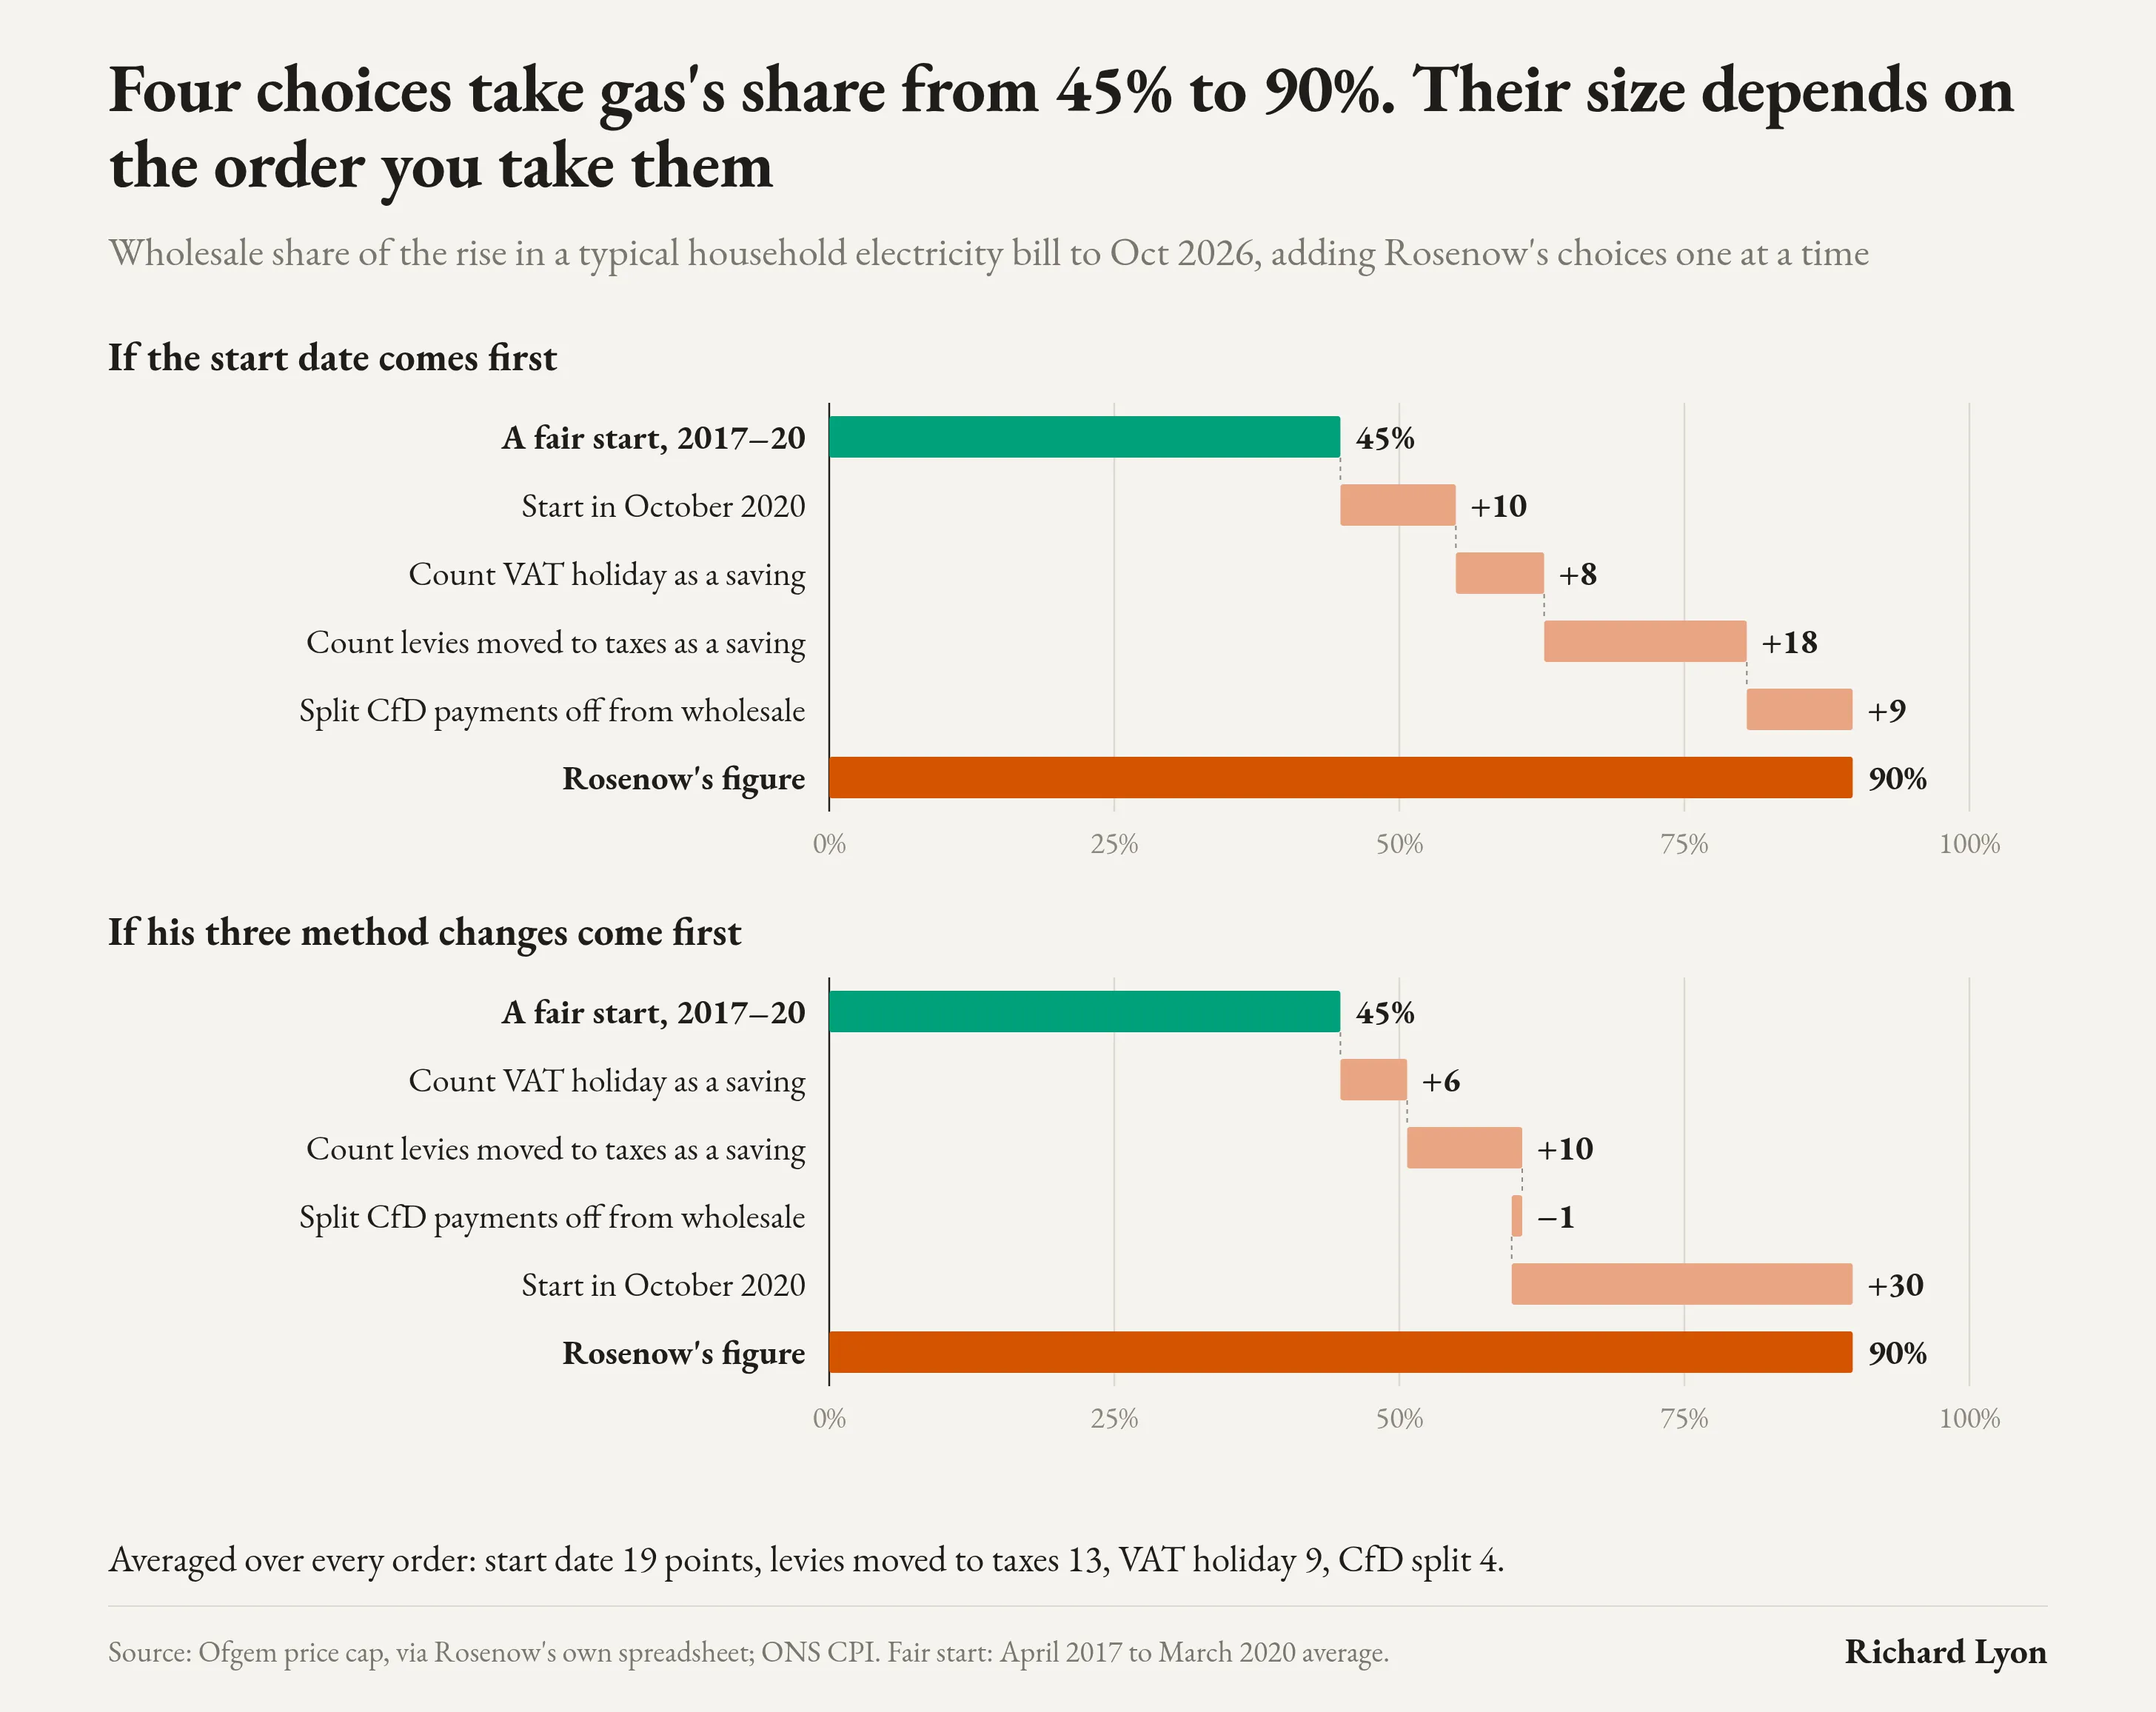
How much each choice adds depends on the order you take them in. Averaged over every order, the start date is worth 19 points, the levies moved to taxes 13, the VAT holiday 9 and the CfD split 4.
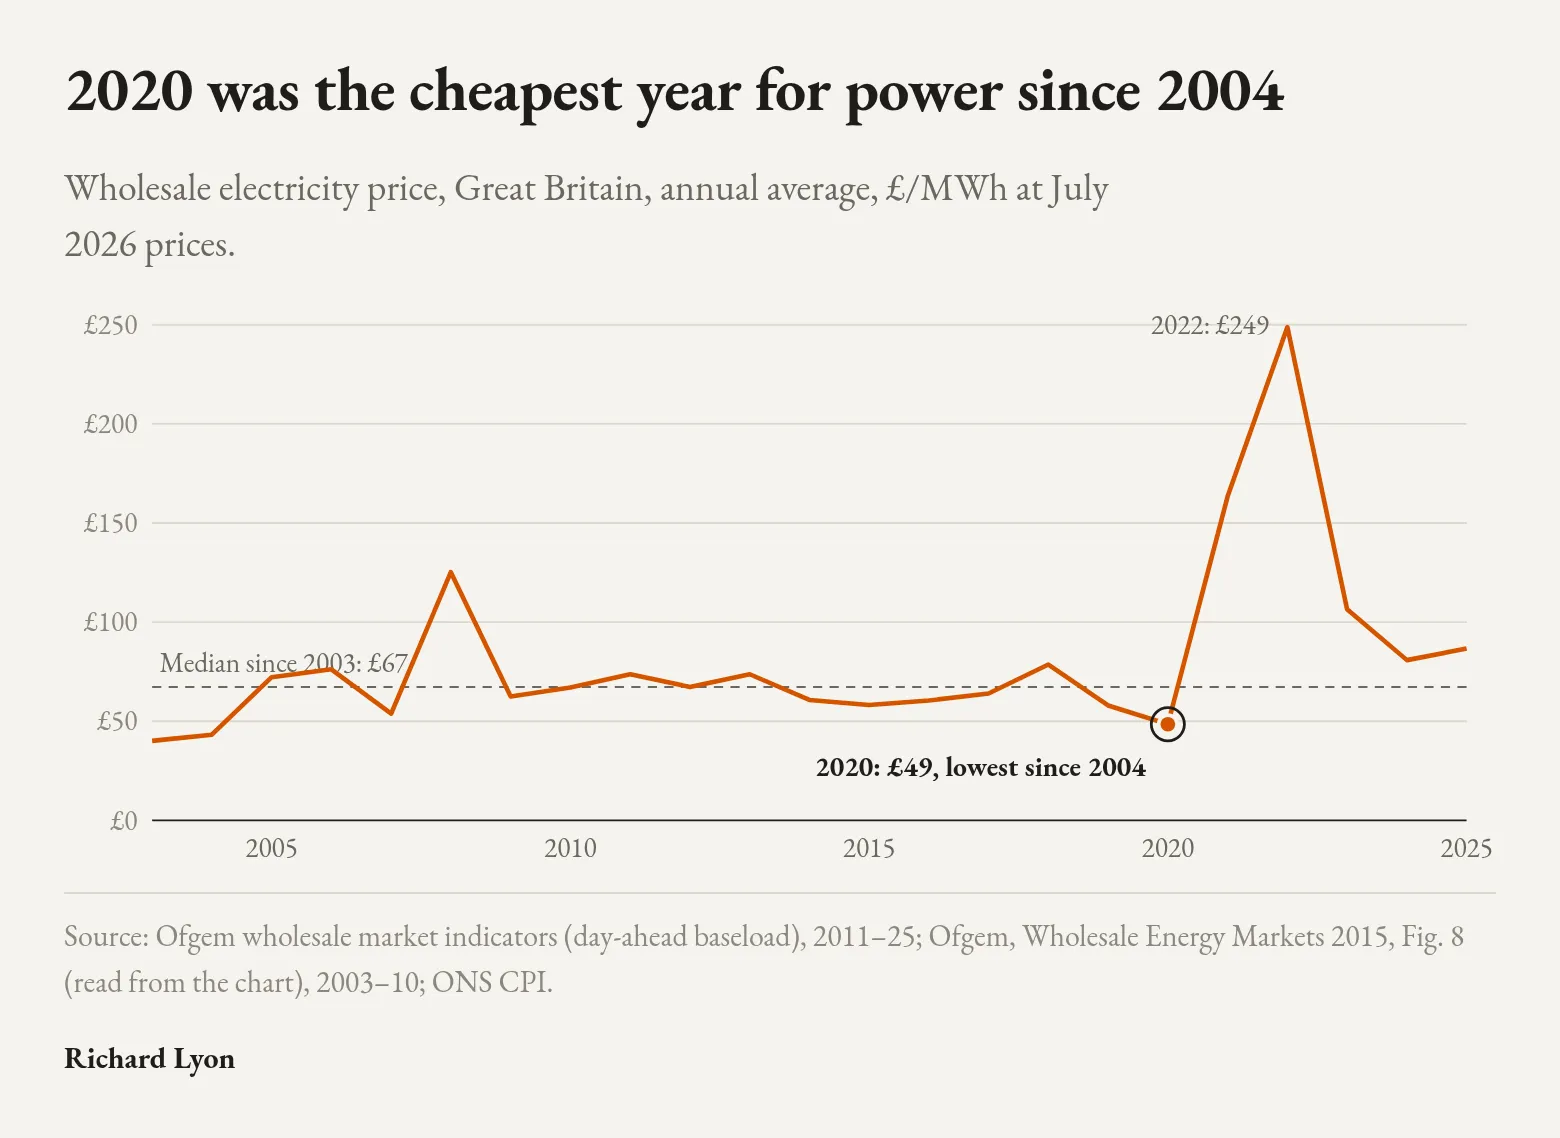
- A fair start. April 2017 to March 2020, the three years before Covid. In 2017–19 wholesale power averaged £67/MWh in today’s money. That is the median since 2003, and a little below the median since 2005 (£72). If anything it is a low start, which favours his figure.
- Start in October 2020. With CfDs split off, as Rosenow does, the wholesale cost on a typical bill was lower then than in any period since 2017. Start at a low and the rise from it looks bigger.
- Count the VAT holiday as a saving. Electricity carries no VAT from October 2026 to March 2027. A six-month tax holiday does not make power cheaper.
- Count levies moved to taxpayers as a saving. In April 2026 part of the policy costs moved from bills to general taxation. The cost has not gone; it is paid through taxes instead.
- Split CfD payments off from wholesale. CfDs pay low-carbon generators the difference between the market price and a fixed price, either way. When wholesale prices rise, what bill payers pay into CfDs falls. The CfD line also depends on how much generation is on CfDs, not on price alone. Keeping CfDs inside wholesale is a choice; the chart above shows what it is worth.
October 2020 was a low
Method and notes
Typical household, single-rate electricity, direct debit, 2,500 kWh a year, GB average, from Ofgem’s Annex 9 levels as embedded in Rosenow’s spreadsheet. CfD share from Ofgem Annex 2. Each start is inflated to July 2026 prices with ONS CPI from the first month of the period, as Rosenow does for October 2020. Built from the same Ofgem sheet his spreadsheet uses, our rebuild gives his spreadsheet’s October 2020 table (wholesale +£161, CfDs −£17, networks +£72, operating +£46, capacity market +£19, other −£19, VAT −£32, policy −£51) and his 2018/19 table to the pound.
The first chart stops at October 2021. For most starts after that, his net measure shows the bill falling or barely rising, so his share swings wildly and means nothing. On the corrected measure, the costs left on the bill rose from every start between April 2024 and January 2026, and wholesale’s share of that rise is 25% to 61%.
The corrected measure leaves out every change in policy costs, not only the part moved to taxes, and that favours his figure. If the levies moved to taxpayers had stayed on the bill at their January to March 2026 level, the corrected share from the 2017–20 start would be about 37%.
Price-cap levels before January 2019 are Ofgem’s indicative estimates. Wholesale prices for 2003–10 are read from an Ofgem chart; from 2011 they are Ofgem’s day-ahead market data. On the 2011–25 data alone the median is £74/MWh.